Updated 1 year ago
Countries That Use the Most Solar Energy in 2024
Written by
Ben Zientara

Are solar panels worth it near me?
Key takeaways
-
China uses the most solar energy and also produces most of the solar panels in the world.
-
The United States is the second largest producer of solar energy and is rapidly growing its solar manufacturing capabilities.
-
In terms of watts of solar capacity per capita, the Netherlands leads the pack, followed by Australia.
Countries that use the most solar energy
Country | Solar generation capacity (MW) | Population | Watts per person | Estimated solar energy generation (GWh) |
|---|---|---|---|---|
China | 609,921 | 1,410,710,000 | 432 | 664,439 |
United States | 139,205 | 334,914,895 | 416 | 227,711 |
Japan | 89,077 | 124,516,650 | 715 | 96,981 |
Germany | 81,739 | 84,482,267 | 968 | 96,453 |
India | 73,109 | 1,428,627,663 | 51 | 96,981 |
Brazil | 37,449 | 216,422,446 | 173 | 44,225 |
Australia | 32,612 | 26,638,544 | 1,224 | 39,160 |
Spain | 31,016 | 48,373,336 | 641 | 43,304 |
Italy | 29,795 | 58,761,146 | 507 | 34,129 |
Netherlands | 23,904 | 17,879,488 | 1,337 | 20,829 |
Numbers represent both solar thermal and solar photovoltaic (PV) electricity generation as of the end of 2023, sourced from the International Renewable Energy Agency (IRENA). Generation numbers estimated based on 2022 production ratios from IRENA. Population numbers for the same point in time sourced from the World Bank.
China leads the world in solar power generation, with 609,921 megawatts (MW) of installed capacity as of December 2023. That is more than four times the amount of solar installed than the second place United States, but both countries have about the same number of installed watts per person because China’s population is so much greater.
The rest of the top 10 include Japan, India, and Australia, alongside European countries like Germany, Italy, Spain, and The Netherlands, all of which have high demand for renewable energy. Not shown on this list are France, the United Kingdom, and Poland, which are 12th, 14th, and 15th in the world in terms of installed capacity. South Korea (11th place) and Vietnam (13th) round out the top 15.
Solar energy per capita
When looking at the number of watts per capita, The Netherlands comes in first, with 1,337. That’s more than three 400-watt solar panels per person! But the amount of electricity generated from solar in the Netherlands is much lower than in other countries because the country experiences much less sun overall.
These numbers illustrate the difference between power and energy. All solar panels are able to generate a certain amount of power under full sun, but the amount of energy they produce over time depends on the total amount of sunlight they receive. Solar panels are more effective in sunnier places on the Earth.
Where is solar most effective?

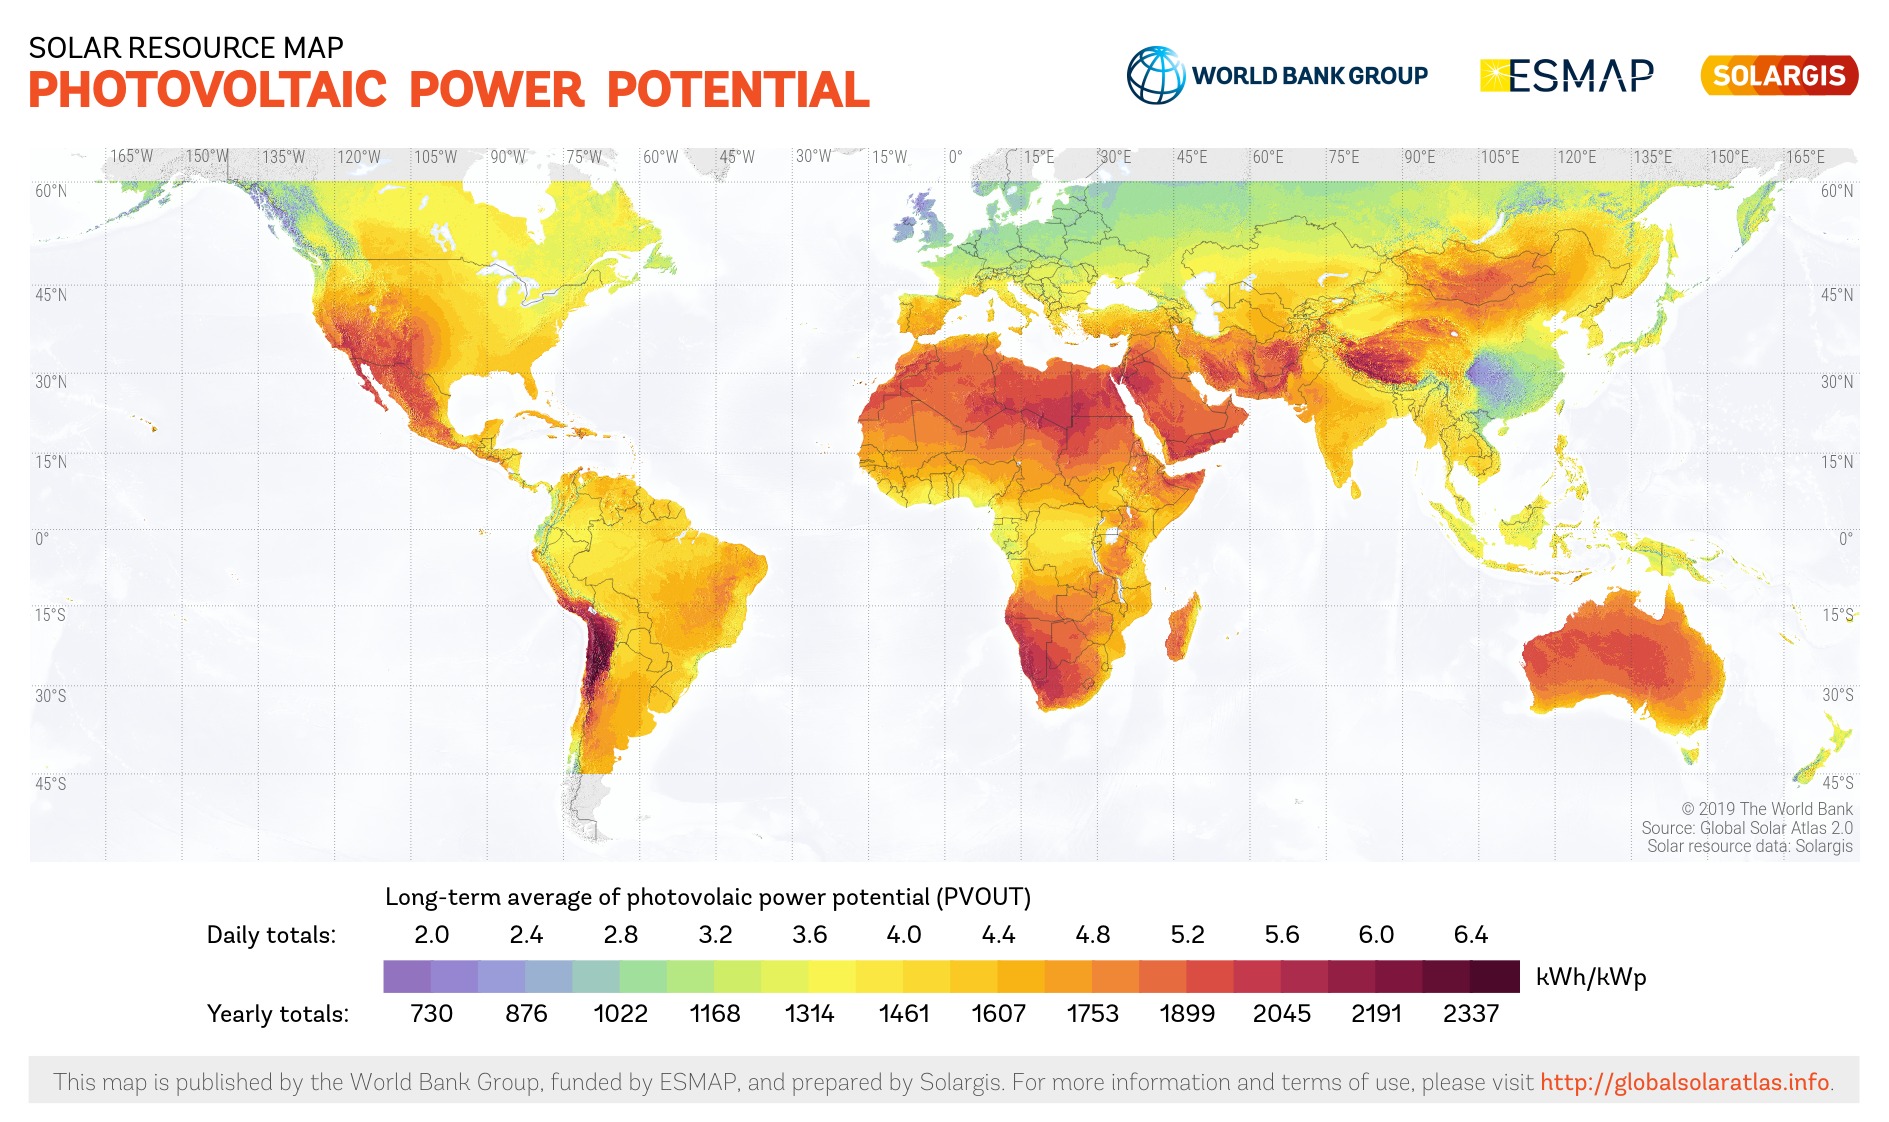
Image source: Global Solar Atlas
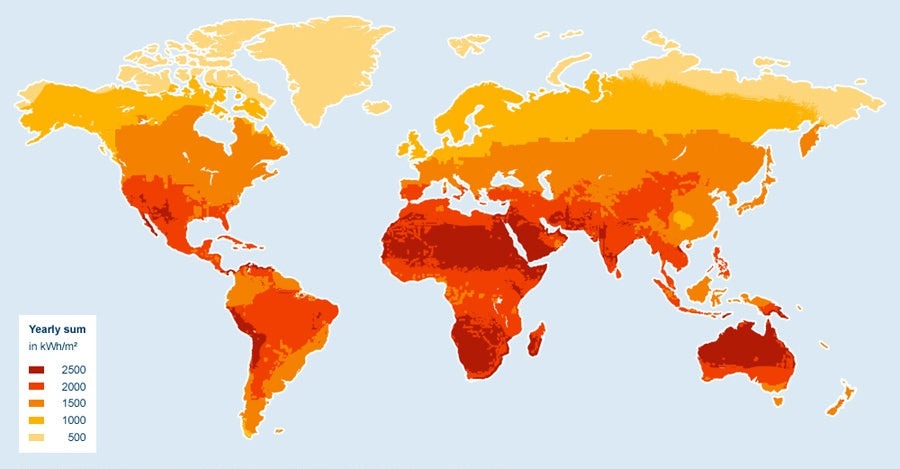
Solar radiation produced from the sun’s energy is abundant in most places on Earth, but some locations are more suitable for solar power generation than others. Solar installations have higher electricity production in places where the sun shines all year long, such as in deserts and high plateaus.
Some of the countries with the most sunlight are on the top 10 solar capacity list, such as Australia and India, but there is huge potential in Africa and South America to grow solar generation.
U.S. States that use the most solar energy
State | Installed solar capacity (MW) |
|---|---|
California | 38,565 |
Texas | 21,310 |
Florida | 12,449 |
North Carolina | 7,267 |
Arizona | 7,201 |
Nevada | 6,179 |
New York | 5,293 |
Georgia | 4,603 |
Massachusetts | 4,286 |
Virginia | 4,647 |
Source: U.S. EIA Electric Power Monthly, November 2024, Table 6.2B
In the United States, California is the leader in installed solar energy capacity, with 38,565 megawatts (MW) as of August 2024. Solar capacity in Texas is growing quickly, and despite being known for wind energy, the state may overtake California in solar capacity in the next two years.
As the table shows, most solar generating capacity is located in very sunny states, but places like New York and Massachusetts are on the list because of state policies that encourage the development of renewable energy sources like solar projects.
The data used in the table above includes numbers for solar thermal and solar PV capacity from both large-scale power plants and small-scale power system installations. The top four states for solar capacity (California, Texas, Florida, and North Carolina) have more capacity together than all other states combined.
Where are solar panels manufactured?
As with the data on power capacity and energy production, China also leads the world in solar manufacturing. According to the International Energy Agency (IEA), Chinese manufacturers built 510 gigawatts (GW) of solar modules in 2023, accounting for 84.6% of the market.
Here are the numbers for the top five countries:
Country | GW of solar modules manufactured in 2023 |
|---|---|
China | 510 |
Vietnam | 21 |
India | 16.6 |
Thailand | 14.1 |
United States | 13.5 |
Data source: IEA Trends in PV Applications 2024
In addition to accounting for the vast majority of solar module manufacturing, China also produces nearly all of the necessary raw materials and components, including 92% of the polysilicon, 98% of silicon wafers, and 91.8% of solar cells in the world.
United States solar manufacturing has long been dominated by First Solar, which makes modules using thin-film solar technology, which is used in utility-scale solar farms. Recently, the country has experienced rapid growth in silicon-based solar manufacturing, driven by incentives in the Inflation Reduction Act of 2022. The U.S. also has a small but significant amount of polysilicon raw material mining.
Where is solar power used the most?
China uses the most solar power of all countries in the world. In addition, China produces the vast majority of raw materials and finished products in the solar industry, accounting for nearly 85% of all solar panels manufactured worldwide.
As the world seeks to curb carbon emissions by replacing fossil fuels with clean energy sources like solar and wind power, there is an enormous opportunity for all countries to build new solar power capacity and manufacturing facilities.
Ben Zientara is a writer, researcher, and solar policy analyst who has written about the residential solar industry, the electric grid, and state utility policy since 2013. His early work included leading the team that produced the annual State Solar Power Rankings Report for the Solar Power Rocks website from 2015 to 2020. The rankings were utilized and referenced by a diverse mix of policymakers, advocacy groups, and media including The Center...
Learn more about Ben Zientara