Updated 1 year ago
What residential solar installers need to stop doing immediately
Written by
Ben Zientara
Author's note: I wrote this article scolding solar installers for overestimating future growth in electricity prices in 2021, before some major nationwide changes in energy markets due to inflation and the war in Ukraine. Since then, the national average cost of electricity has increased by more than 10%, with some states that rely on natural gas power plants seeing increases of 20%-30% or more.
I don’t know whether electricity prices will return to their 25-year average growth rates in the future, but neither does anyone else. I do know that it’s important for solar installers to give their customers accurate, truthful information about past increases, and couch that data in a discussion about how solar panels can protect their owners from price spikes like those the country has experienced in the past couple of years.
For most homeowners with sunny roofs, solar panels are a good financial decision today. Scrupulous salespeople can show that without resorting to scare tactics and fudged numbers.
I’ve left the article below mostly as it appeared in 2021, with notes where new information is available.
I’ve been studying and writing about home solar power in the U.S. for the better part of a decade now, so I get a lot of questions from friends and family who are considering solar panels. They want to know whether solar panels really last for 25 years or more (they do), whether they increase home value (they do), and whether the estimates of electricity bill savings in a solar quote are accurate (well… it depends).
That last one is the big one, right? After all, around 70% of people rated “saving money on electric bills” as the most important factor in the decision to go solar in their responses to our huge survey of homeowners considering solar.
It’s pretty easy to provide accurate numbers for solar production and electricity bill savings for the first year. Most installers do a great job with this, using software that models production based on roof orientation and tilt, shading, and historical weather patterns.
What’s harder is settling on a number for the expected rate of increase in electricity prices over the next 25 years. Unfortunately, on this point, some installers completely miss the mark in providing those homeowners with complete information.
Key takeaways
-
The long-term historical rate of increase in electricity prices is about 2.9%.
-
With the challenges of inflation, climate change, and grid upgrades, there are reasons to believe that the rate may go up slightly over the next few decades.
-
Even if the rate of utility cost increases is at or below historical levels, solar makes economic sense for many homeowners.
-
Some solar installers use estimates of annual energy cost increases as high as 5% to make solar look like a better investment than it might otherwise be.
-
Instead, installers should show homeowners low-increase and high-increase scenarios, and explain that going solar reduces uncertainty at the same time it helps the planet and raises home value.
-
Homeowners should make sure they check their utility company’s historical rate of increase and make their decision based on various savings scenarios.
Examples of bad behavior
I have some friends who were moving into a new house in New Mexico and got two competing quotes. One of the solar companies estimated that electricity prices would increase by 5% per year, while the other estimated 4.5%. I did some checking, and PNM’s historic rate of increase is 1.26% over the last 25 years (as of March, 2023, this number is now 2.1%, still less than half of the original estimate).
Another time, my brother and sister-in-law in Minnesota got two quotes that used 3% and 4% annual increases, while a third quote didn’t even mention the rate they used. Their utility company, Dakota Electric, had seen a 1.3% annual increase in rates since the mid-90s (about 1.7% now in 2023).
Now, to be clear, there is no guarantee that historical rates of utility cost increase will be carried forward to the future. Many factors go into utility price increases, and utility companies ask for higher rates almost every year. Some years—or even decades—see low increases, while other years see big jumps due to major capital improvements made, but the averages always come out about the same.
Electricity price increases around the country
Electricity prices have increased, on average, 2.9% per year in the USA since 1960, and that rate drops to 2.36% when you look at just the data for the 25 years between 1997 and 2022 (the latest available data).
To be fair, there are a few scattered places in the country where electricity prices have risen by more than 4% per year for over two decades (Hawaii, Los Angeles, and parts of Oregon and Massachusetts to name a few), but these are the exceptions, not the rule.
Yes, there are reasons to believe that the rate of increase in utility prices may go up in the coming years. Inflation, the cost of grid modernization and upgrades, and the potential for carbon taxes in response to climate change may all play a role in driving electricity prices up faster than they have historically risen.
Still, the idea that we’ll see sustained increases as high as 5% per year seems more than a little far-fetched. When a utility company wants to raise prices, they have to submit a rate case to be approved by their state’s version of a Public Utilities Commission (PUC). It’s difficult to imagine PUCs in all 50 states approving new annual retail electric rate increases of 5% per year for the next 25 years.
The effects of bad utility rate increase estimates
When installers estimate high levels of increase in utility bills, they’re not making a small potential error.
Take a look at the chart below, which shows how a current average electric bill of $100 per month could increase, given rates of increase of 1.3%, 3%, and 5%.
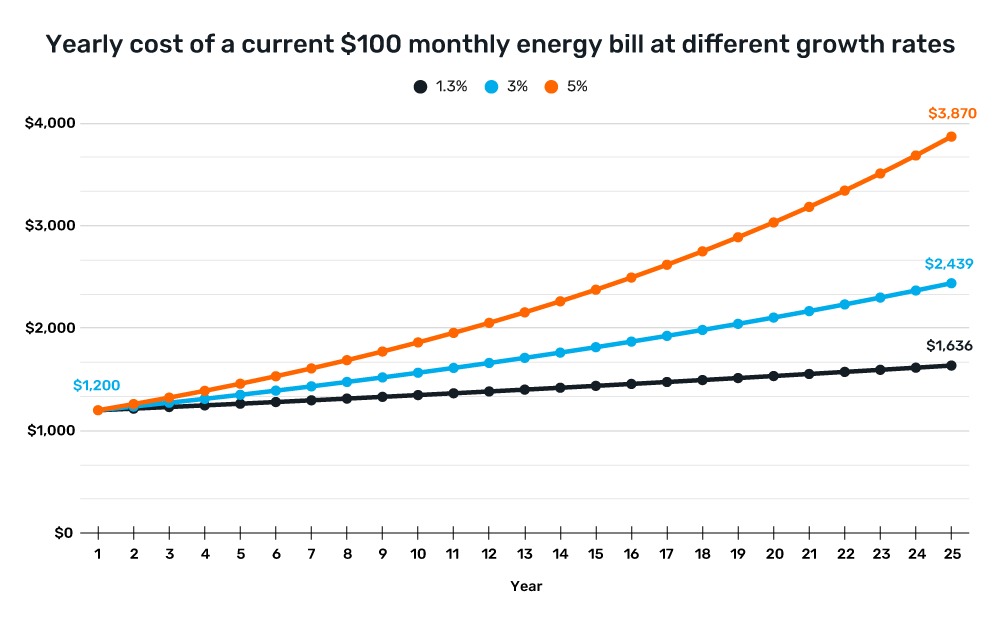
As the chart shows, if my friend in New Mexico spends $100 a month on electricity and prices continue to increase by an average of 1.3% per year, they can expect to be spending about $136 per month 25 years from now.
But the solar quote they got assumed a 5% annual increase, which would result in $323 average monthly bills in 25 years. The difference between the high and low estimates is staggering. At 5% annual growth, utility bills double in about 16 years. Are you paying double the rate you did 16 years ago? I’m not. Almost nobody (outside of Hawaii) is.
That 5% growth assumption would mean more than $22,000 in additional spending on energy over the 25-year period. The solar installer would like my friends to believe that all that extra money they would have spent will instead be savings, making the investment in solar look much better than if they had used historical numbers.
What solar installers should do instead
The bottom line is this: solar installers should make sure the systems they quote are priced so that the homeowner will see a good return on their investment at reasonable rates of electricity cost increases.
If a solar installer feels like they have to show a customer an inflated estimate of utility cost increase to sell a system, maybe they shouldn’t be selling that system.
Rather than hide this important information in the small print, installers should be upfront about the historical rate of increase in electricity prices, the rate they use to calculate long-term savings, and the reasons for the difference. When solar installers use ultra-high estimates for the rate of growth in electricity prices, then include those estimates only in the fine print, they do everyone a disservice.
As workers in the solar industry, it is our job to provide complete information about why home solar panels are better than grid power for most people. If we show people misleading information, we risk doing damage to our customers, our reputations, and the home solar industry as a whole.
Installers should also point out that while electricity prices may not rise as fast as they predict, going solar now protects people from uncertainty in the future. We need only look at what happened in Texas in February of 2021 to see what can happen when deregulated energy markets experience huge price shocks.
Home solar removes that possibility, providing folks with a good estimate of their levelized cost of electricity over time (the cost of the system divided by the discounted value of all the energy it is estimated to produce).
Final thoughts
The ideal solar quote would show a low-increase scenario alongside a higher-increase scenario that allows customers to make up their own minds.
When I was working to help my brother decide if going solar was right for him, we ran the numbers for the low and high-increase scenarios. He decided that the net present value (NPV) for his investment in solar panels in Minnesota was good enough at a 1.3% increase in utility costs, and went on to choose the company that gave him the best sales experience.
Selling solar isn’t about pushing a customer into a decision based on illogical numbers. Solar installers should present accurate, transparent information that clearly explains the potential risks and benefits, and work alongside homeowners to help them make a decision that feels right.
That’s how we grow our industry: integrity and honesty, not malarkey in the fine print.
Ben Zientara is a writer, researcher, and solar policy analyst who has written about the residential solar industry, the electric grid, and state utility policy since 2013. His early work included leading the team that produced the annual State Solar Power Rankings Report for the Solar Power Rocks website from 2015 to 2020. The rankings were utilized and referenced by a diverse mix of policymakers, advocacy groups, and media including The Center...
Learn more about Ben Zientara